Table of Contents
Who, what, when, where, why
– Who: Iran-linked militias and other state-affiliated forces mounted the recent strike campaign.
– What: Attacks struck shipping and energy infrastructure, forcing temporary shutdowns and rerouted shipments.
– When: Markets reacted sharply in early March, notably on March 2 and March 3.
– Where: Disruptions centered on the Strait of Hormuz and nearby Gulf facilities.
– Why: The incidents pushed up short-term risk premia for crude oil and liquefied natural gas (LNG).
Overview
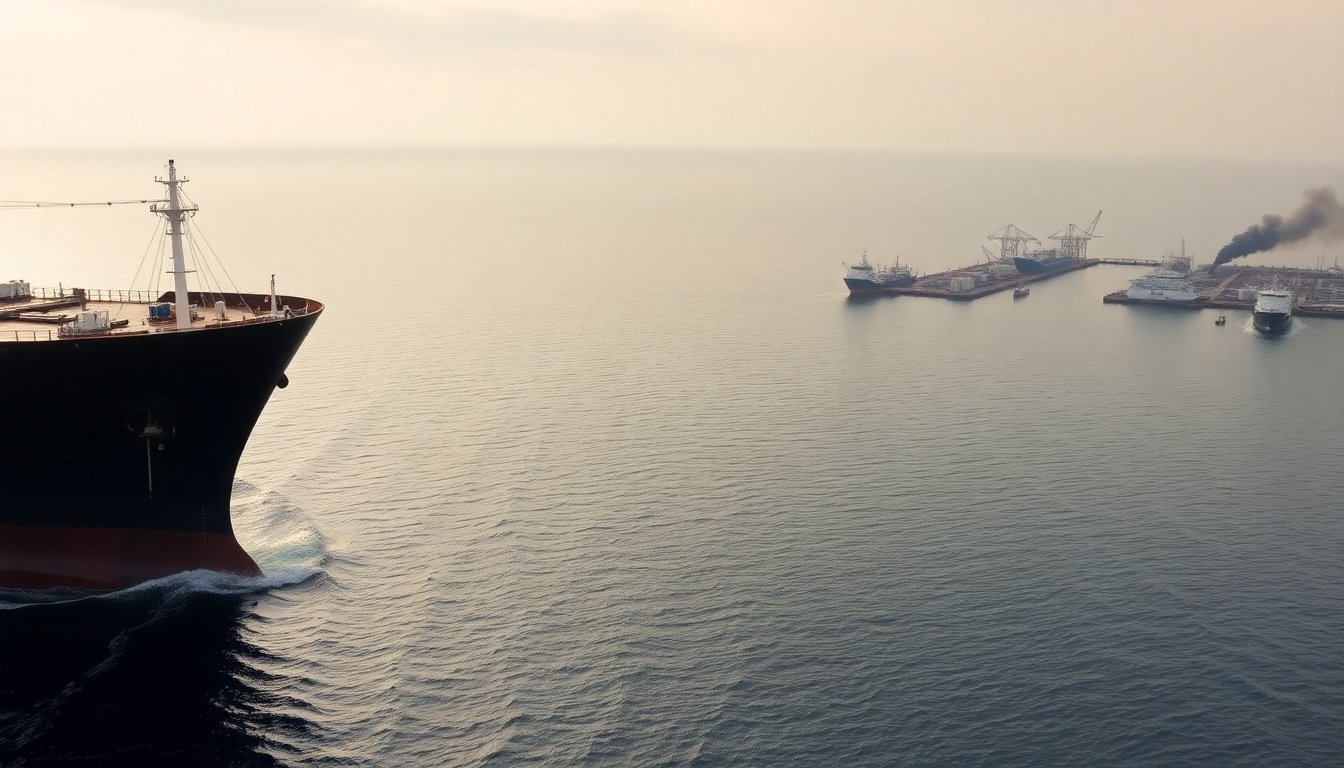
Localized security shocks are now reaching global energy markets faster than before. Ships transiting the Strait of Hormuz were delayed or diverted, operators idled facilities to protect staff and equipment, and buyers instantly repriced supply risk and logistics costs. That chain of events showed up in spot and near-term forward curves for both crude and LNG.
How the strikes affected oil markets
Price moves and blockade risks
Markets showed immediate sensitivity. Brent futures jumped after the strikes as traders factored in higher insurance, longer voyage times and constrained timely deliveries. When shipping bottlenecks or refinery outages tighten perceived supply, prices can climb within hours.
How long elevated prices persist hinges on scale and duration. A brief, repairable disruption typically creates a transient spike. Sustained attacks or an effective blockade would impose a more persistent premium on Middle East barrels and ripple through global markets. The Strait of Hormuz remains a critical chokepoint: if transit is curtailed, rerouting adds time and cost and diminishes options for prompt cargoes.
Industry responses and market mechanics
Energy firms responded quickly—idling damaged units, diverting exports through pipelines or alternative ports, and drawing down inventories. Those steps help avoid immediate shortages but complicate logistics and raise shipping costs, which traders price into futures. Data on anchorage congestion, insurance premiums and tanker routes will be the earliest indicators of normalization.
Scenario space
Analysts sketch several paths: rapid restoration of flows; a drawn-out partial blockade that keeps premiums elevated; or widening attacks that force long-term rerouting and contractual shifts. Winners in the near term are refineries with flexible feedstocks; losers include import-dependent economies with limited storage. Practical preparation includes mapping single-point failures in logistics, expanding contracted throughput outside the region, and stress-testing supply agreements for extended delays.
Price thresholds and capacity limits
Some models suggest crude could overshoot $100–$108 per barrel if key chokepoints stay effectively closed, but peak levels depend on attack intensity and duration, the capacity of the actor sustaining the pressure, and how quickly naval or diplomatic measures restore safe passage. Naval escorts and diplomatic de-escalation would blunt the worst outcomes; the ability to sustain harassment—munitions, logistics, and stockpiles—sets an upper bound on how long markets would remain under strain.
Why gas markets are even more sensitive
Structural vulnerability
Gas markets are inherently less flexible than oil. LNG and pipeline flows depend on tight scheduling, refrigeration and fixed liquefaction capacity. That means cancellations or delays can cascade quickly through contracts, storage cycles and power systems, producing steeper short-term premiums than oil.
Rapid repricing and contagion
Spot gas markets can reprice within hours of a new disruption. Limited spare liquefaction and regional delivery constraints amplify price responses: a single cancelled cargo can force fuel switching at power plants, curtail industrial output, or send price spikes to hubs in Europe and Asia.
Practical implications
Market participants should increase visibility on cargo positions, stress-test against route closures, and flesh out contingency plans for fuel switching or demand response. Policymakers can shorten disruption windows by coordinating maritime security and escort operations. Near-term signals to watch include anchorage build-ups, changes in export paperwork, and naval deployments.
Overview
Localized security shocks are now reaching global energy markets faster than before. Ships transiting the Strait of Hormuz were delayed or diverted, operators idled facilities to protect staff and equipment, and buyers instantly repriced supply risk and logistics costs. That chain of events showed up in spot and near-term forward curves for both crude and LNG.0
Winners, losers and geopolitical reorientation
Overview
Localized security shocks are now reaching global energy markets faster than before. Ships transiting the Strait of Hormuz were delayed or diverted, operators idled facilities to protect staff and equipment, and buyers instantly repriced supply risk and logistics costs. That chain of events showed up in spot and near-term forward curves for both crude and LNG.1
Overview
Localized security shocks are now reaching global energy markets faster than before. Ships transiting the Strait of Hormuz were delayed or diverted, operators idled facilities to protect staff and equipment, and buyers instantly repriced supply risk and logistics costs. That chain of events showed up in spot and near-term forward curves for both crude and LNG.2
Mitigation, escalation risks and policy levers
Overview
Localized security shocks are now reaching global energy markets faster than before. Ships transiting the Strait of Hormuz were delayed or diverted, operators idled facilities to protect staff and equipment, and buyers instantly repriced supply risk and logistics costs. That chain of events showed up in spot and near-term forward curves for both crude and LNG.3
Overview
Localized security shocks are now reaching global energy markets faster than before. Ships transiting the Strait of Hormuz were delayed or diverted, operators idled facilities to protect staff and equipment, and buyers instantly repriced supply risk and logistics costs. That chain of events showed up in spot and near-term forward curves for both crude and LNG.4
Overview
Localized security shocks are now reaching global energy markets faster than before. Ships transiting the Strait of Hormuz were delayed or diverted, operators idled facilities to protect staff and equipment, and buyers instantly repriced supply risk and logistics costs. That chain of events showed up in spot and near-term forward curves for both crude and LNG.5
Takeaways and what to watch
- – Key indicators: tanker traffic patterns, anchorage congestion, insurance premium moves, export filings and naval deployments.
- Near-term risks: fast, sharp price spikes for oil and especially gas; strained logistics and higher shipping and insurance costs.
- Preparations that matter: mapping single-point failures, securing alternative throughput, prebooking cargoes, and expanding strategic stock buffers.
- Strategic shift: expect policy and commercial decisions to favor resilience—diversified routes, more storage and flexible contracting—over efficiency alone.
Overview
Localized security shocks are now reaching global energy markets faster than before. Ships transiting the Strait of Hormuz were delayed or diverted, operators idled facilities to protect staff and equipment, and buyers instantly repriced supply risk and logistics costs. That chain of events showed up in spot and near-term forward curves for both crude and LNG.6